MLFlow on GCP for Experiment Tracking
We will setup MLFlow on GCP for distributed experiment tracking.


- Virtual Machine as The Tracking Server
- Database as the Backend Store
- Google Cloud Storage Bucket as Artifact Store
- Run the MLFlow Server on Tracking Server
I searched over the internet and couldn't find a good step by step tutorial on setting up MLFlow on GCP. That's why I decided to write a tutorial on that.
In this blog post, I will show the steps to setup MLFlow on Google Cloud for distributed experiment tracking. MLFlow can be used for machine learning experiment tracking. There are several ways to use MLFLow which you can check them here.
The architecture that we want to implement here is like scenario number 5 and would be as the following image:
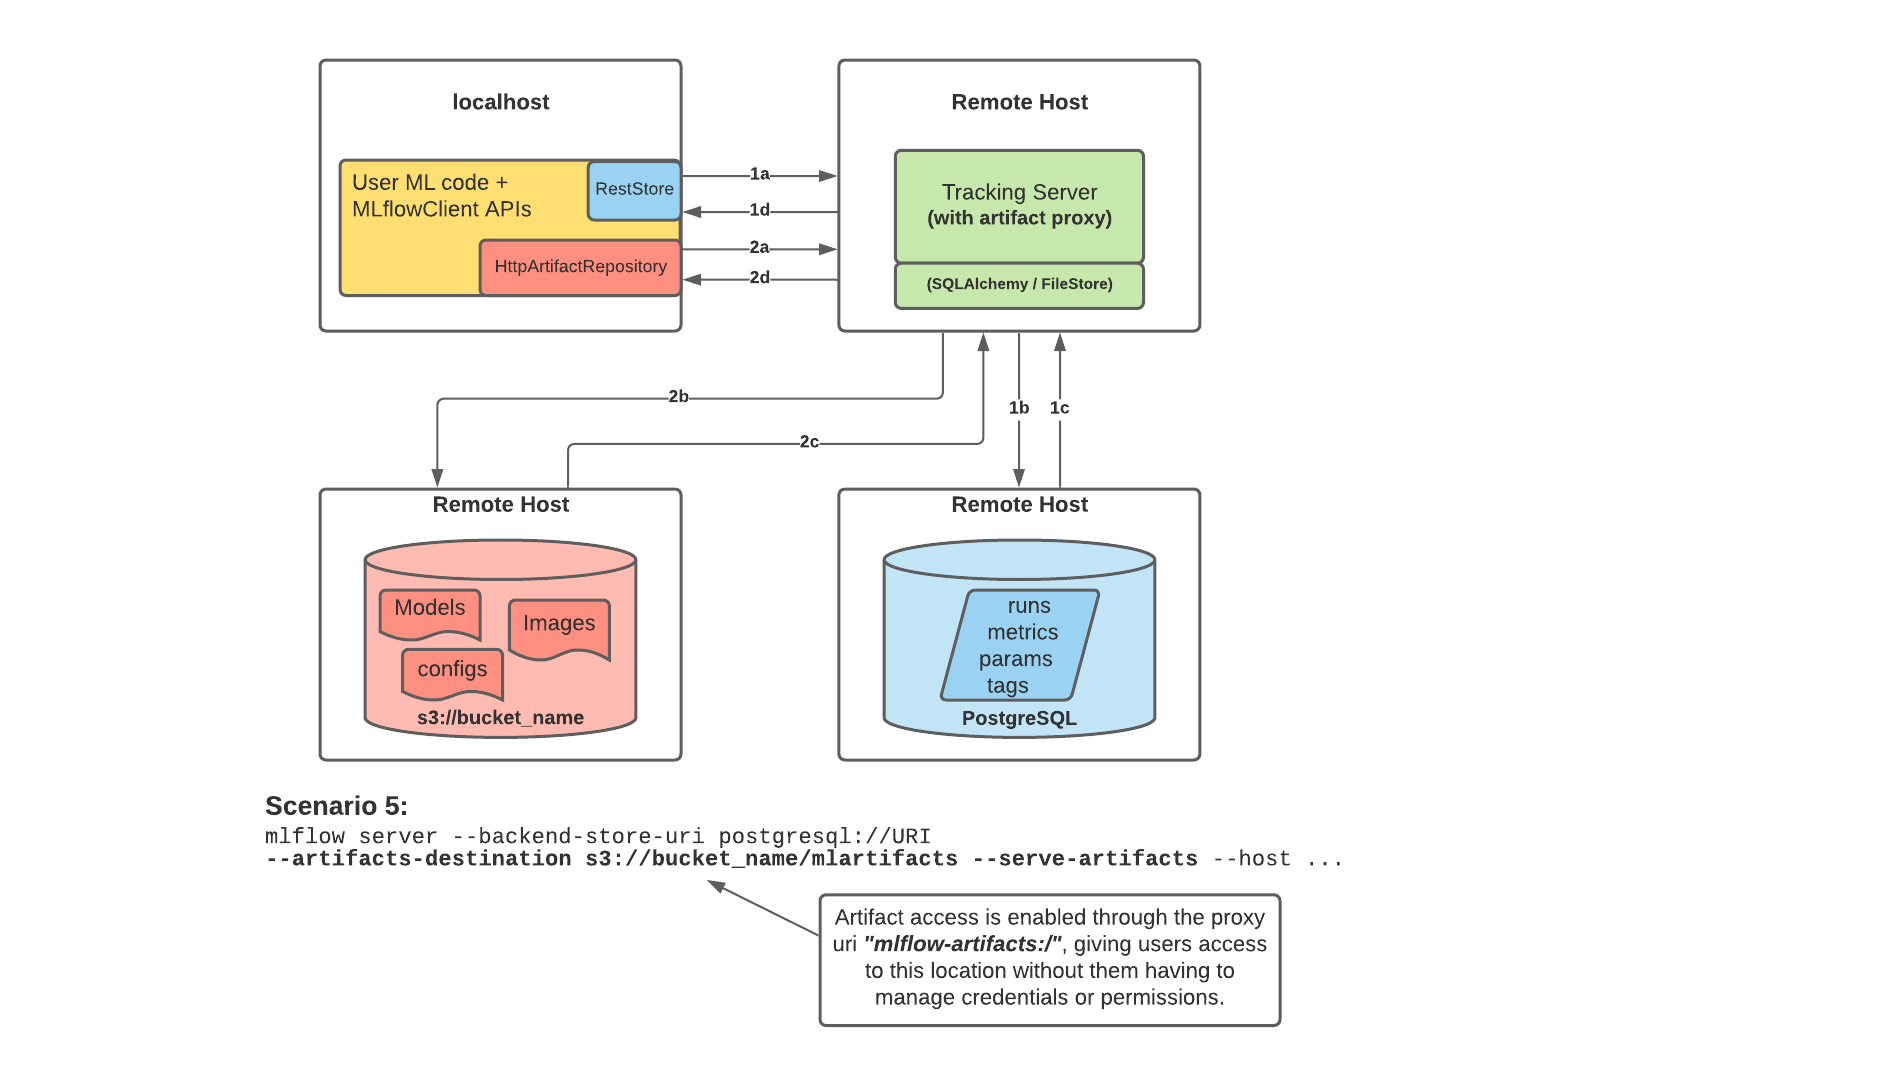
This is useful for teams with multiple data scientists to have one tracking server to be shared between all of them. So they all can do their experimentation and have everything in one place. The tracking server is not also dependent on the backend store and artifact store and can be scaled. In addition, the scientists will not lose their local data if they want to scale their machine or change it. Everything is decentralised.
Here is the explanation from MLFLow documentation:
MLflow’s Tracking Server supports utilizing the host as a proxy server for operations involving artifacts. Once configured with the appropriate access requirements, an administrator can start the tracking server to enable assumed-role operations involving the saving, loading, or listing of model artifacts, images, documents, and files. This eliminates the need to allow end users to have direct path access to a remote object store (e.g., s3, adls, gcs, hdfs) for artifact handling and eliminates the need for an end-user to provide access credentials to interact with an underlying object store.
Enabling the Tracking Server to perform proxied artifact access in order to route client artifact requests to an object store location:
Part 1a and b:
The MLflow client creates an instance of a RestStore and sends REST API requests to log MLflow entities.
The Tracking Server creates an instance of an SQLAlchemyStore and connects to the remote host for inserting tracking information in the database (i.e., metrics, parameters, tags, etc.)
Part 1c and d:
Retrieval requests by the client return information from the configured SQLAlchemyStore table
Part 2a and b:
Logging events for artifacts are made by the client using the HttpArtifactRepository to write files to MLflow Tracking Server
The Tracking Server then writes these files to the configured object store location with assumed role authentication
Part 2c and d:
Retrieving artifacts from the configured backend store for a user request is done with the same authorized authentication that was configured at server start
Artifacts are passed to the end user through the Tracking Server through the interface of the HttpArtifactRepository
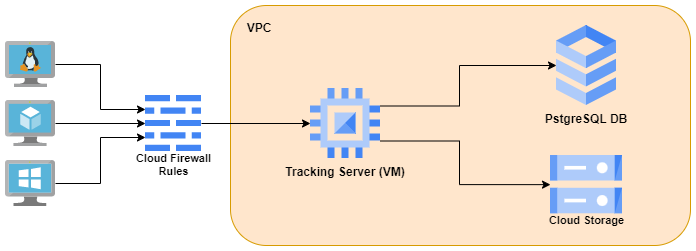
In this distributed architecture, we will have :
- one virtual machine as tracking server
- one google storage bucket as artifact store - persists artifacts (files, models, images, in-memory objects, or model summary, etc).
- one PostgreSQL as backend store - persists MLflow entities (runs, parameters, metrics, tags, notes, metadata, etc).
The architecture on GCP would be like the following image:
Virtual Machine as The Tracking Server
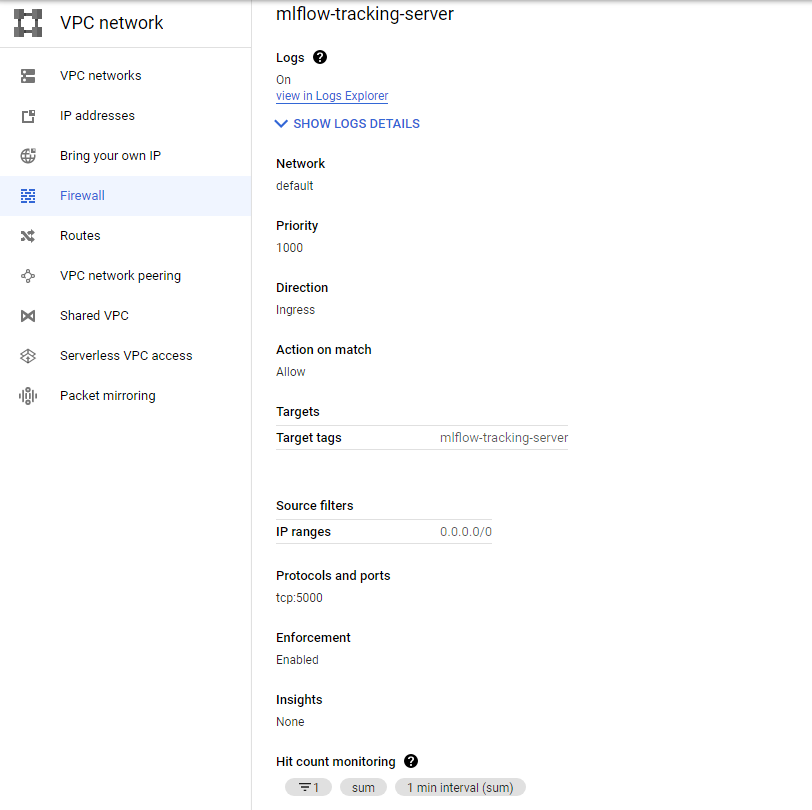
We need a firewall rule which can be created like the following:
gcloud compute firewall-rules create mlflow-tracking-server \
    --network default \
    --priority 1000 \
    --direction ingress \
    --action allow \
    --target-tags mlflow-tracking-server \
    --source-ranges 0.0.0.0/0 \
    --rules tcp:5000 \
    --enable-logging
Here is the firewall rule after creation:
We then can create a virtual instance as the tracking server.
gcloud compute instances create mlflow-tracking-server \
    --project=<PROJECT_ID> \
    --zone=europe-west1-b \
    --machine-type=e2-standard-2 \
    --network-interface=network-tier=PREMIUM,subnet=default \
    --maintenance-policy=MIGRATE \
    --provisioning-model=STANDARD \
    --service-account=<PROJECT_NUMBER>-compute@developer.gserviceaccount.com \
    --scopes=https://www.googleapis.com/auth/cloud-platform \
    --tags=mlflow-tracking-server \
    --create-disk=auto-delete=yes,boot=yes,device-name=mlflow-tracking-server,image=projects/ubuntu-os-cloud/global/images/ubuntu-2004-focal-v20220610,mode=rw,size=10,type=projects/<PROJECT_ID>/zones/europe-west1-b/diskTypes/pd-balanced \
    --no-shielded-secure-boot \
    --shielded-vtpm \
    --shielded-integrity-monitoring \
    --reservation-affinity=any
change PROJECT_ID based on your project. You can also change other configs like zone, machine, etc. if you want. Note that you have to change them in multiple places. The service account is the default service account for compute engine and is as follows:
PROJECT_NUMBER-compute@developer.gserviceaccount.com
Where PROJECT_NUMBER is the project number of the project that owns the service account. You can find it here.
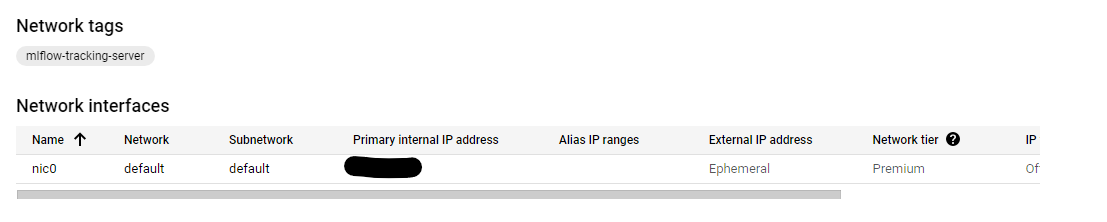
You can also use the UI to simply create the virtual machine. Just make sure you use the default network for VPC and the created firewall rule for the networks tags in the Network Interfaces section. Also give the VM Allow full access to all Cloud APIsi in the Management -> availability policies section.
Here is the networking section of the VM after creation (other configs can be based on your choice):
Database as the Backend Store
We also need a PostgreSQL database as the backend store.
- Go to GCP dashboard and search for SQL and then select
create instanceand the selectPostgreSQL. - Put a name and password for the instance. Select the Database version and region. You can choose one option for Zonal availability too.
- Expand the
Customize your instancepart, and in connections, selectPrivate IPand deselectPublic IPand from the drop down options forNetworkinPrivate IPpart, selectdefault. This is the VPC which our virtual machine should be also on it too. So the VM and DB can see eachother. - You can change other configs for the DB too. I leave them as their default values.
- Select
Create Instanceoption.
It will take you to the overview page and will take some time to create the database instance. Then we can create a database. GCP will create a default one named postgres, but I will create a new one.
Then go to the Databases section and select Create Database and name it mlflow_db, for example.
Then we need to create a user too. Go to the User section and click on the Add User Account. Select a username and password for that.
Now, you should be able to connect to the tracking server via ssh and run the following command to install and then see the list of databases. You can see the created database with its private IP.
sudo apt-get update
sudo apt-get install postgresql-client
gcloud sql instances list
Then run the following command to see if you can connect to the database.
psql -h CLOUD_SQL_PRIVATE_IP_ADDRESS -U USERNAME DATABASENAME
It will ask you for the password for the user you created before.
Now that you can connect to the database from the tracking server using private IP, let's go to the next part.
Run the MLFlow Server on Tracking Server
Now we have all the resources. Go back to the ssh terminal for the tracking server or connect to it again. I had some problems with installing the required python packages. So I created a virtual env and installed the packages there.
sudo apt install python3.8-venv
python3 -m venv mlflow
source mlflow/bin/activate
pip install mlflow boto3 google-cloud-storage psycopg2-binary
Then run the mlflow server:
mlflow server \
    -h 0.0.0.0 \
    -p 5000 \
    --backend-store-uri postgresql://<user>:<pass>@<db private ip>:5432/<db name> \
    --default-artifact-root gs://<bucket name>/<folder name>
Then you can go to http:<tracking server external IP>:5000 address and you should see the mlflow UI!
Now, you can train a model on your machine or another VM and log mlflow data.
import mlflow
import os

TRACKING_SERVER_HOST = "<tracking server external IP>"
mlflow.set_tracking_uri(f"http://{TRACKING_SERVER_HOST}:5000")

print(f"tracking URI: '{mlflow.get_tracking_uri()}'")

from sklearn.linear_model import LogisticRegression
from sklearn.datasets import load_iris
from sklearn.metrics import accuracy_score

mlflow.set_experiment("my-experiment-1")

with mlflow.start_run():

    X, y = load_iris(return_X_y=True)

    params = {"C": 0.1, "random_state": 42}
    mlflow.log_params(params)

    lr = LogisticRegression(**params).fit(X, y)
    y_pred = lr.predict(X)
    mlflow.log_metric("accuracy", accuracy_score(y, y_pred))

    mlflow.sklearn.log_model(lr, artifact_path="models")
    print(f"default artifacts URI: '{mlflow.get_artifact_uri()}'")

mlflow.list_experiments()
Note that you need to install google-cloud-storage via pip on your machine.
You should now see my-experiment-1 in the output of the above code and also in UI (refresh the page if you don't see it).
You can also assign a fixed external IP address for your tracking server. So you don't need to change it in the code everytime you start the VM. You can do this by going to the IP addresses section in VPC network as shown in the below image:
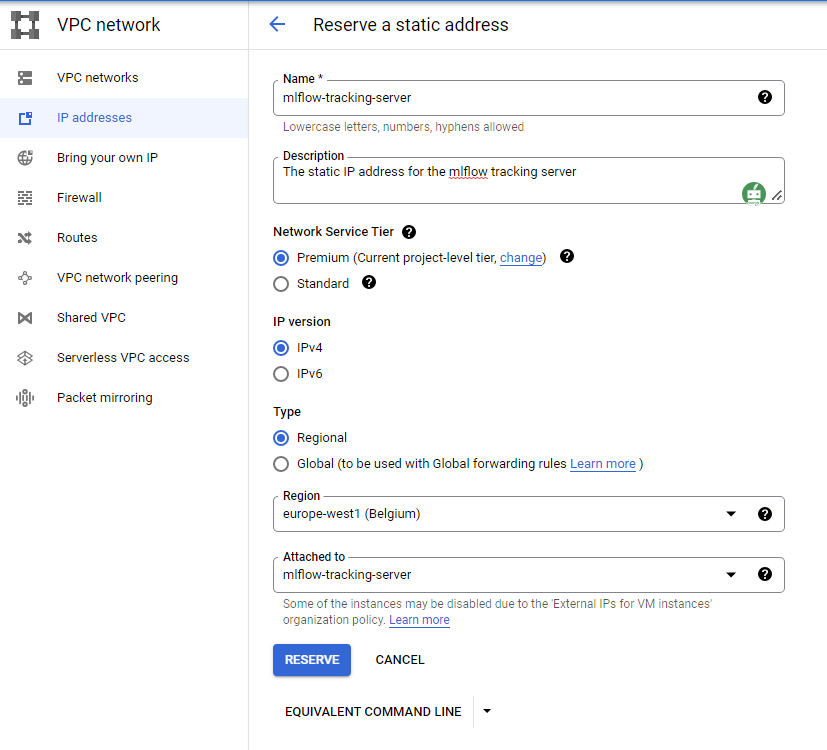
Now if you check the mlflow-tracking-server VM, you should see the External IP even if the VM is stopped.
That's it for this post. I will try to replace VM with cloud run in future posts. I also think about having a login UI that each user should sign in to access the mlflow UI.